Learn Data Analytics
Professional Data Analytics Online Course
Expert-led Data Analytics Training
Industry-recognized certification
Hands-on projects and real-world case studies.
Flexible online learning
Internship
Request Course Information
Learn Data Analytics
Expert-led Data Analytics Training
Industry-recognized certification
Hands-on projects and real-world case studies.
Flexible online learning
Internship
Upcoming Class Schedule
Feb 15th 2025
6PM - 9PM
Graduates & Early to Mid-career Professionals
Duration
120 Hours
Mode
Online
Format
Hands-On Training
Suited For
Graduates & Early to Mid-career Professionals
Each weeks
4 Weeks
Each Session
6 Sessions
Instructor
Data Analytics prepares graduates and professionals with skills to analyze data, extract insights, and enhance decision-making, opening doors to career growth in data-driven industries.
As a global business hub, the UAE highly demands certified data analytics professionals. Our Data Analytics course, considered the best statistics course for data analytics provides the skills you need to succeed in this booming industry.
Companies are actively hiring for roles that require expertise in data sources and visualization.
Companies are actively hiring for roles that require expertise in data sources and visualization.
Get hands-on experience with Power BI, Data Visualization Tableau, and SQL to stay ahead.
As a global business hub, the UAE highly demands certified data analytics professionals. Our Data Analytics course, considered the best statistics course for data analytics provides the skills you need to succeed in this booming industry.









From mastering basic SQL to diving deep into data transformation techniques, this course lays the foundation for understanding data sources and utilizing powerful tools like Power BI and Tableau.
For Graduates: Start your data analyst career with beginner-friendly modules:
For Mid-Career Professionals: Advance your career with data analytics:
Crafted with over 25 years of expertise to deliver comprehensive knowledge and practical skills in data analytics.
Overview:
This module focuses on mastering Microsoft Excel for data analysis. Students will learn key functionalities, from formulas to advanced features like macros and Power Pivot, essential for creating dashboards and generating insights.
Areas of Study:
Microsoft Excel Basics
Learn the essentials of Excel, including navigation and basic operations.
Formulas & Functions
Understand and apply various formulas and functions to analyze data efficiently.
Pivot Tables
Gain expertise in summarizing, analyzing, and presenting data using pivot tables.
Dashboards and Insights Writing
Design interactive dashboards and write actionable insights.
Data Analysis Using Excel
Utilize Excel's tools for in-depth data analysis.
Macros
Automate repetitive tasks using macros.
Power Pivot
Analyze large datasets and build sophisticated data models.
Outcomes:
Proficiency in advanced Excel features for data analysis.
Ability to create professional dashboards and derive actionable insights.
Foundational knowledge for advanced analytics tools.
Overview:
This module provides a strong foundation in database management using MySQL. Students will learn to manipulate, query, and manage relational databases effectively.
Areas of Study:
DBMS Introduction and Basics of MySQL
Understand database fundamentals and MySQL basics.
Data Types and Keys
Learn about different data types and the concept of primary and foreign keys.
SQL Sub-Languages
Master DML, DDL, DQL, DCL, and TCL commands.
Functions
Apply date/time, string, and arithmetic functions.
Joins and Set Operations
Perform complex queries using joins and set operations.
Subqueries and Views
Work with nested queries and create database views.
Procedures and Triggers
Automate processes using stored procedures and triggers.
Normalization
Learn normalization techniques to optimize database design.
Outcomes:
Expertise in SQL for managing and querying databases.
Ability to write complex queries and optimize database performance.
Knowledge of advanced SQL concepts like procedures and triggers.
Overview:
This module covers essential statistical concepts used in data analysis, including descriptive and inferential statistics, regression, and hypothesis testing.
Areas of Study:
Descriptive Statistics
Learn measures of central tendency and variability.
Probability Theory
Understand the fundamentals of probability.
Inferential Statistics
Perform sampling, estimation, and hypothesis testing.
Hypothesis Testing
Test assumptions using statistical methods.
Regression Analysis
Analyze relationships between variables and predict outcomes.
Outcomes:
Strong foundation in statistical techniques for data analysis.
Ability to perform hypothesis testing and interpret results.
Proficiency in regression analysis for predictive modeling.
Overview:
This module focuses on creating data visualizations and dashboards using Tableau, a leading business intelligence tool.
Areas of Study:
Introduction to Tableau
Learn the basics of Tableau and its interface.
Charts and Visualizations
Create basic and advanced charts.
Pivoting and Transforming Data
Prepare and transform data for analysis.
Working with Time Series Data
Analyze trends and patterns over time.
Performing Calculations
Use calculated fields for dynamic analysis.
Customizing Reference Lines and Maps
Integrate Mapbox for geospatial visualizations.
Designing Interactive Dashboards
Build engaging dashboards.
Principles of Effective Data Storytelling
Convey insights effectively using visualizations.
Outcomes:
Mastery of Tableau for data visualization.
Ability to create interactive dashboards and tell compelling stories with data.
Get hands-on experience in transforming data and building advanced visualizations.
Overview:
This module covers Power BI, a powerful tool for business intelligence, focusing on data transformation, visualization, and dashboard creation.
Areas of Study:
BI Components
Understand the components of business intelligence.
Connecting to Various Data Sources:
Learn to connect and import data.
Datasets and Dataflows
Manage and utilize datasets effectively.
Power Query Editor
Transform data for analysis.
Data Transformation Techniques
Clean and prepare data for reporting.
Introduction to DAX
Write basic and advanced expressions in DAX.
Charts and Visualizations:
Create and customize visualizations.
Advanced Visualization Techniques
Explore sophisticated visualization methods.
Report and Dashboard Creation
Design comprehensive dashboards.
Outcomes:
Expertise in Power BI for business intelligence.
Ability to clean, transform, and visualize data effectively.
Skills in creating professional reports and dashboards.
Allows your business and technology computers to store, transmit, analyze, and manipulate big data.
Data Cleaning & Transformation
SQL Querying & Management
Data Visualization (Tableau, Power BI)
Statistical Analysis & Testing
Predictive Modeling & Machine Learning Basics
Advanced Excel for Analytics
Data Interpretation & Insights
Business Intelligence Tools
Data-Driven Decision Making
Report Writing & Storytelling
Data analytics is not just about crunching numbers—it's about solving problems and driving decisions. Enroll in this course to get the skills for a successful data analyst career and endless opportunities.

Opportunities abound in industries such as:
Our courses are customized to prepare you for beginner data analyst jobs and prepare you for long-term career growth.

We understand the fast-paced lifestyle in Dubai. Our data analysis online course with certificate offers:

As Dubai embraces digital transformation, mid-career professionals can leverage data analytics to:
Sharpen your data analytics skills with hands-on projects that cover everything from data visualization to predictive modeling, preparing you for top industry roles.
Financial Dashboard Creation with Pivot Tables and Macros
Design a dynamic financial dashboard with pivot tables, interactive charts, and macros that analyze and visualize company performance, providing actionable insights.
Regression Analysis for Customer Sales Prediction
Apply regression analysis techniques to predict customer sales behavior, and perform hypothesis testing to evaluate the effectiveness of marketing strategies.
Retail Store Database Design and Query Optimization
Develop a robust database system for a retail store, implementing normalized tables, complex queries, and stored procedures to ensure efficient data management and retrieval.
Interactive Sales Performance Dashboard
Build a time-series sales performance dashboard, integrating data from multiple sources and utilizing Mapbox for geographic insights, while leveraging data storytelling for impactful visualizations.
Business Intelligence Dashboard with DAX and Data Transformations
Create a sophisticated business intelligence dashboard by connecting to multiple data sources, transforming data for advanced analytics, and using DAX for custom calculations and metrics.

Data analytics is a rapidly growing field, and gaining expertise in this area will ensure you stay ahead of the curve, making you more competitive in the job market.
Explore Hub
Eligible learners can get a 1-month internship opportunity with top companies post-course, where you'll work on industry-specific data analytics projects and gain hands-on experience.
Explore Hub
By completing the Data Analytics course, you open doors to top careers such as Data Analyst, Business Analyst, Data Scientist, and Data Engineer.
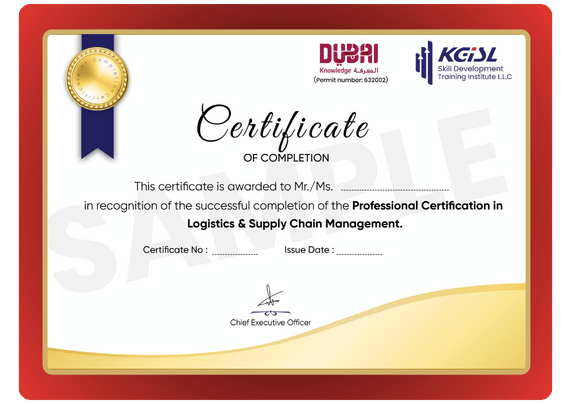
Explore HubEarn an industry-recognized Professional Certification in Data Analytics to highlight your expertise. Share your certification on LinkedIn or your network to unlock new opportunities in data-driven fields.
As a beginner, focus on:
Data analytics positions are among the most in-demand due to their crucial role in decision-making across various industries.
Data science, AI, and cloud engineering roles lead the way in terms of salary, though data analysts with specialized skills can also earn competitive wages.
Proficiency in Power BI, Tableau, and SQL is crucial. Our data analytics Power BI module is tailored for practical applications.
AI enhances analytics but cannot replace the human intuition and strategic thinking a data analyst brings.
The main pillars include data collection, cleaning, transformation, analysis, and visualization.
The duration of the course depends on your pace. On average, KGiSL Skill Development Training Institute’s online data analytics course takes between 5 to 6 months to complete, with self-paced modules that allow you to learn according to your schedule.
No, prior experience is not required. This Data Analytics course is designed for beginners, and we start with foundational concepts. However, familiarity with basic computer skills and an interest in problem-solving will be beneficial.
While the course equips you with the necessary skills, securing a job depends on your efforts, networking, and the job market. Our course prepares you with the practical skills that employers look for. We are here to help you with placements with right companies.

Master of Science in Machine Learning & Artificial Intelligence | Liverpool John Moores University, UK
Executive PG Diploma: ML & AI | International Institute of Information Technology, Bangalore
Bachelor of Engineering in Computer Science | Thiagarajar College of Engineering, Madurai
WhatsApp us
Adding {{itemName}} to cart
Added {{itemName}} to cart